Sports Analytics Engine
A situational query engine and betting-return simulator that re-platforms an Excel research workflow into a database.
The system is a college-basketball betting research platform that turns a spreadsheet-based workflow into a queryable database with a purpose-built situational query engine. We delivered the complete full-stack build: the authenticated frontend, the query engine, the API routes, the PostgreSQL schema and views, and a streaming data-import pipeline.
The product addresses a research problem familiar to serious sports bettors: finding every historical game that matches a situation, not just a stat line. Questions like "how do teams perform against the spread after three straight games shooting below their season average, when traveling to a higher-elevation venue?" are practically impossible to answer in a spreadsheet, yet the source data lived in exactly that form, as large Excel workbooks with one 64-column sheet per team.
Crucially, the platform preserves the established Excel workflow rather than replacing it. Workbooks import as-is through an observable, idempotent pipeline, and the outputs, summary rows, averages rows, and betting-return calculations, intentionally replicate the original workbook's formulas, so the platform's numbers can be verified against the process it replaces.
Situational questions a spreadsheet cannot express
Serious betting research means finding every historical game that matches a situation: streaks, season-to-date averages, travel and elevation context, and conditions on the opponent as well as the team. Filters that reference other games, "after three straight games below their season average", cannot be expressed in a spreadsheet, and are awkward even as SQL.
At the same time, the analyst's entire dataset and methodology lived in Excel: large workbooks with one 64-column sheet per team covering betting lines, box scores, rest days, and travel, plus summary formulas and betting-return calculations. The system had to preserve that established workflow, including its exact numbers, while making multi-condition situational queries fast and repeatable across an entire league's game history.
Keep Excel as the ingestion format, not the analysis tool
Rather than forcing a new data-entry workflow, the platform imports the existing workbooks as-is. A server-side pipeline parses the index sheet, conferences, teams, venues with coordinates and elevation, and every per-team sheet, then loads a normalized PostgreSQL schema through chunked, deduplicated upserts.
We modeled games from both perspectives: each fixture is stored once as a match and twice as team-perspective game rows, with a database view joining each game to both its own and its opponent's box score as embedded JSON, so the query engine reads complete game context in a single fetch.
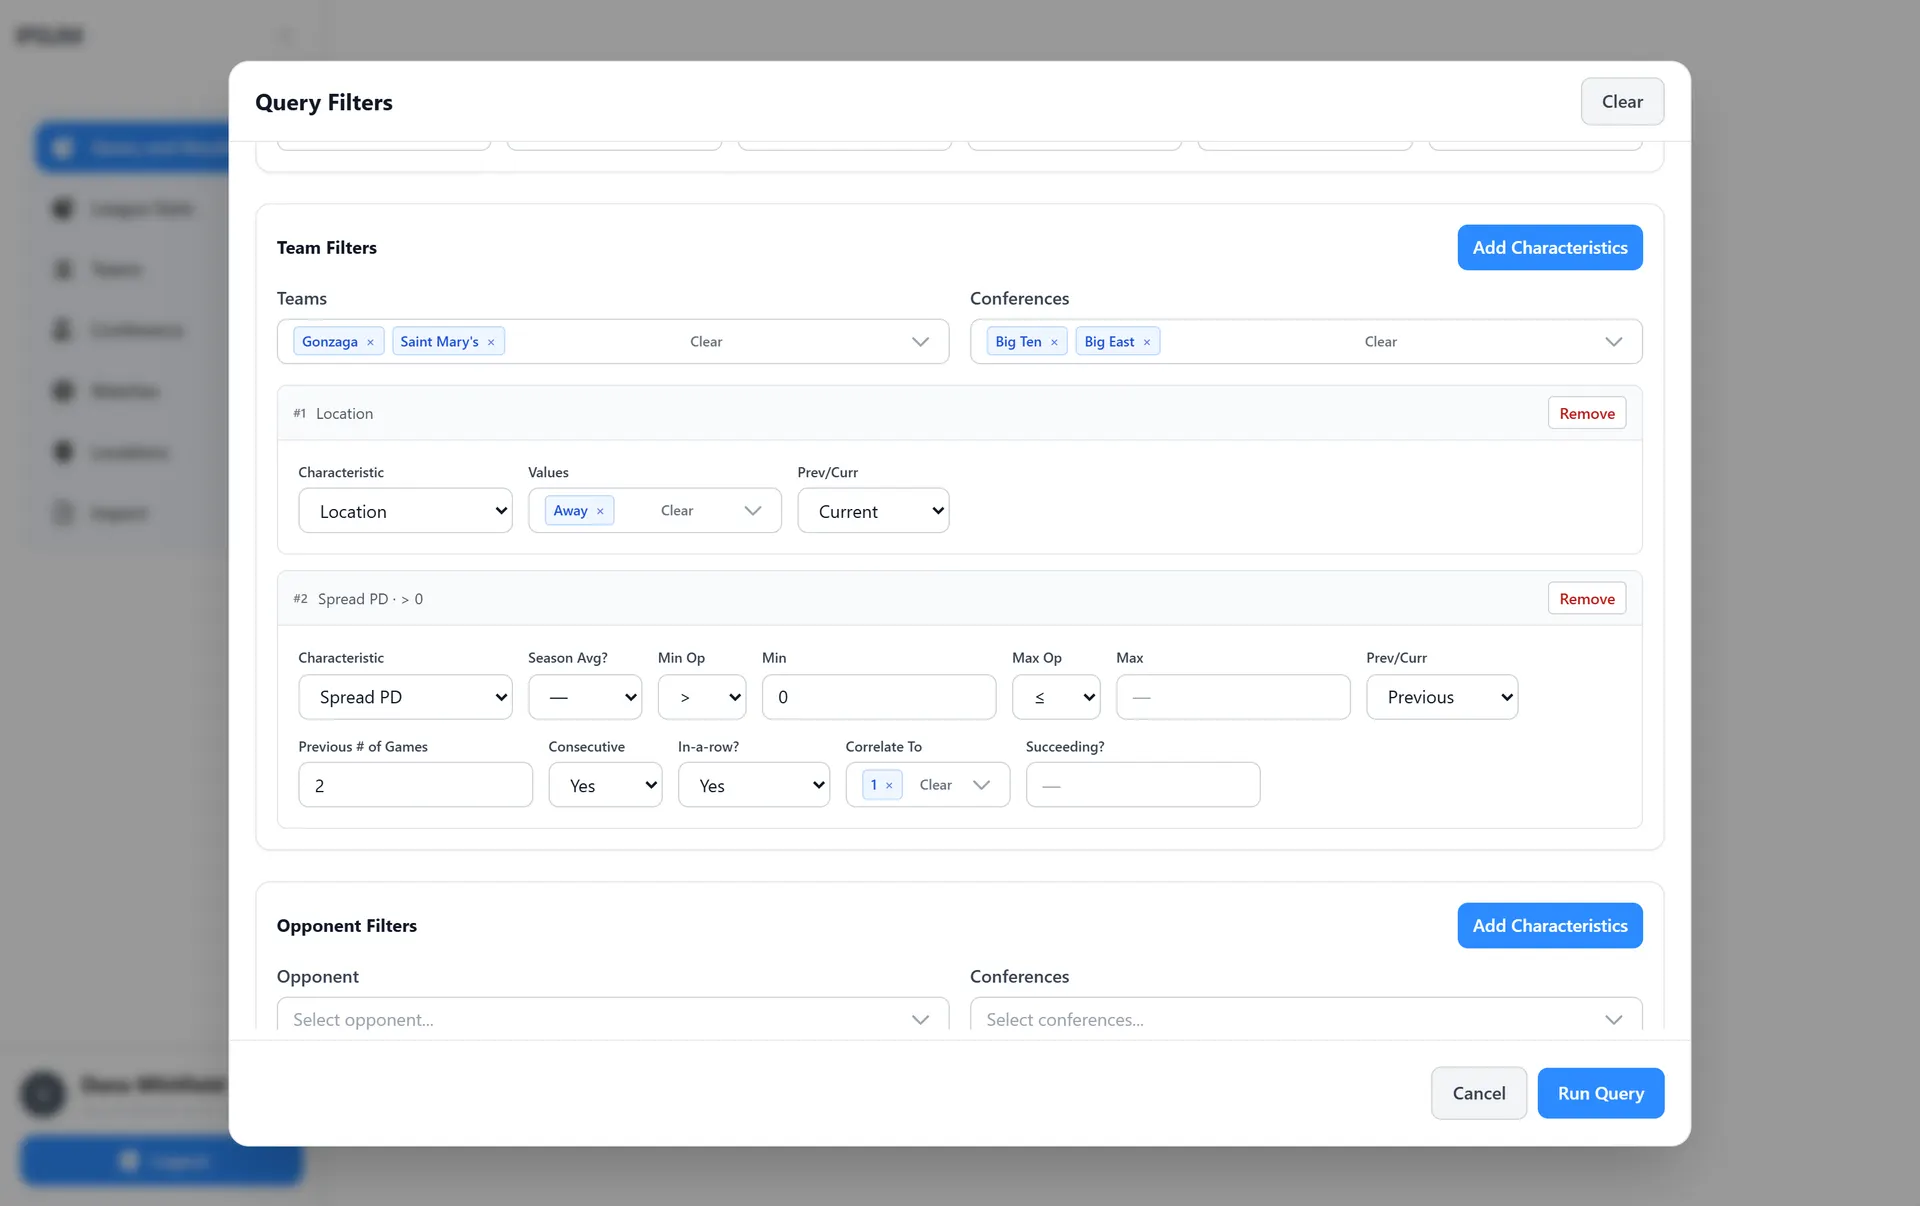
The situational logic lives in a dedicated query engine. Filters that reference other games, streaks, season averages, correlated conditions, cannot be simple WHERE clauses, so the engine fetches each team's full ordered game history once and evaluates layered characteristic filters in application code, keeping the filter semantics explicit and testable.
Query engine, betting simulator, and Excel-faithful grids
An analyst combines date filters, scope filters, teams, conferences, game type, home/away/neutral, overtime, and characteristic conditions across roughly 65 queryable measures spanning betting fields, scoring, rest, ranking, travel distance, elevation change, and the full team and opponent box score. Each characteristic supports current-game thresholds, previous-game conditions with consecutive and in-a-row semantics, season-average conditions, and correlation, restricting prior-game calculations to games that satisfied other filters in the query. Team-side and opponent-side criteria are defined independently, and the engine returns team, opponent, and intersection result sets as switchable tabs.
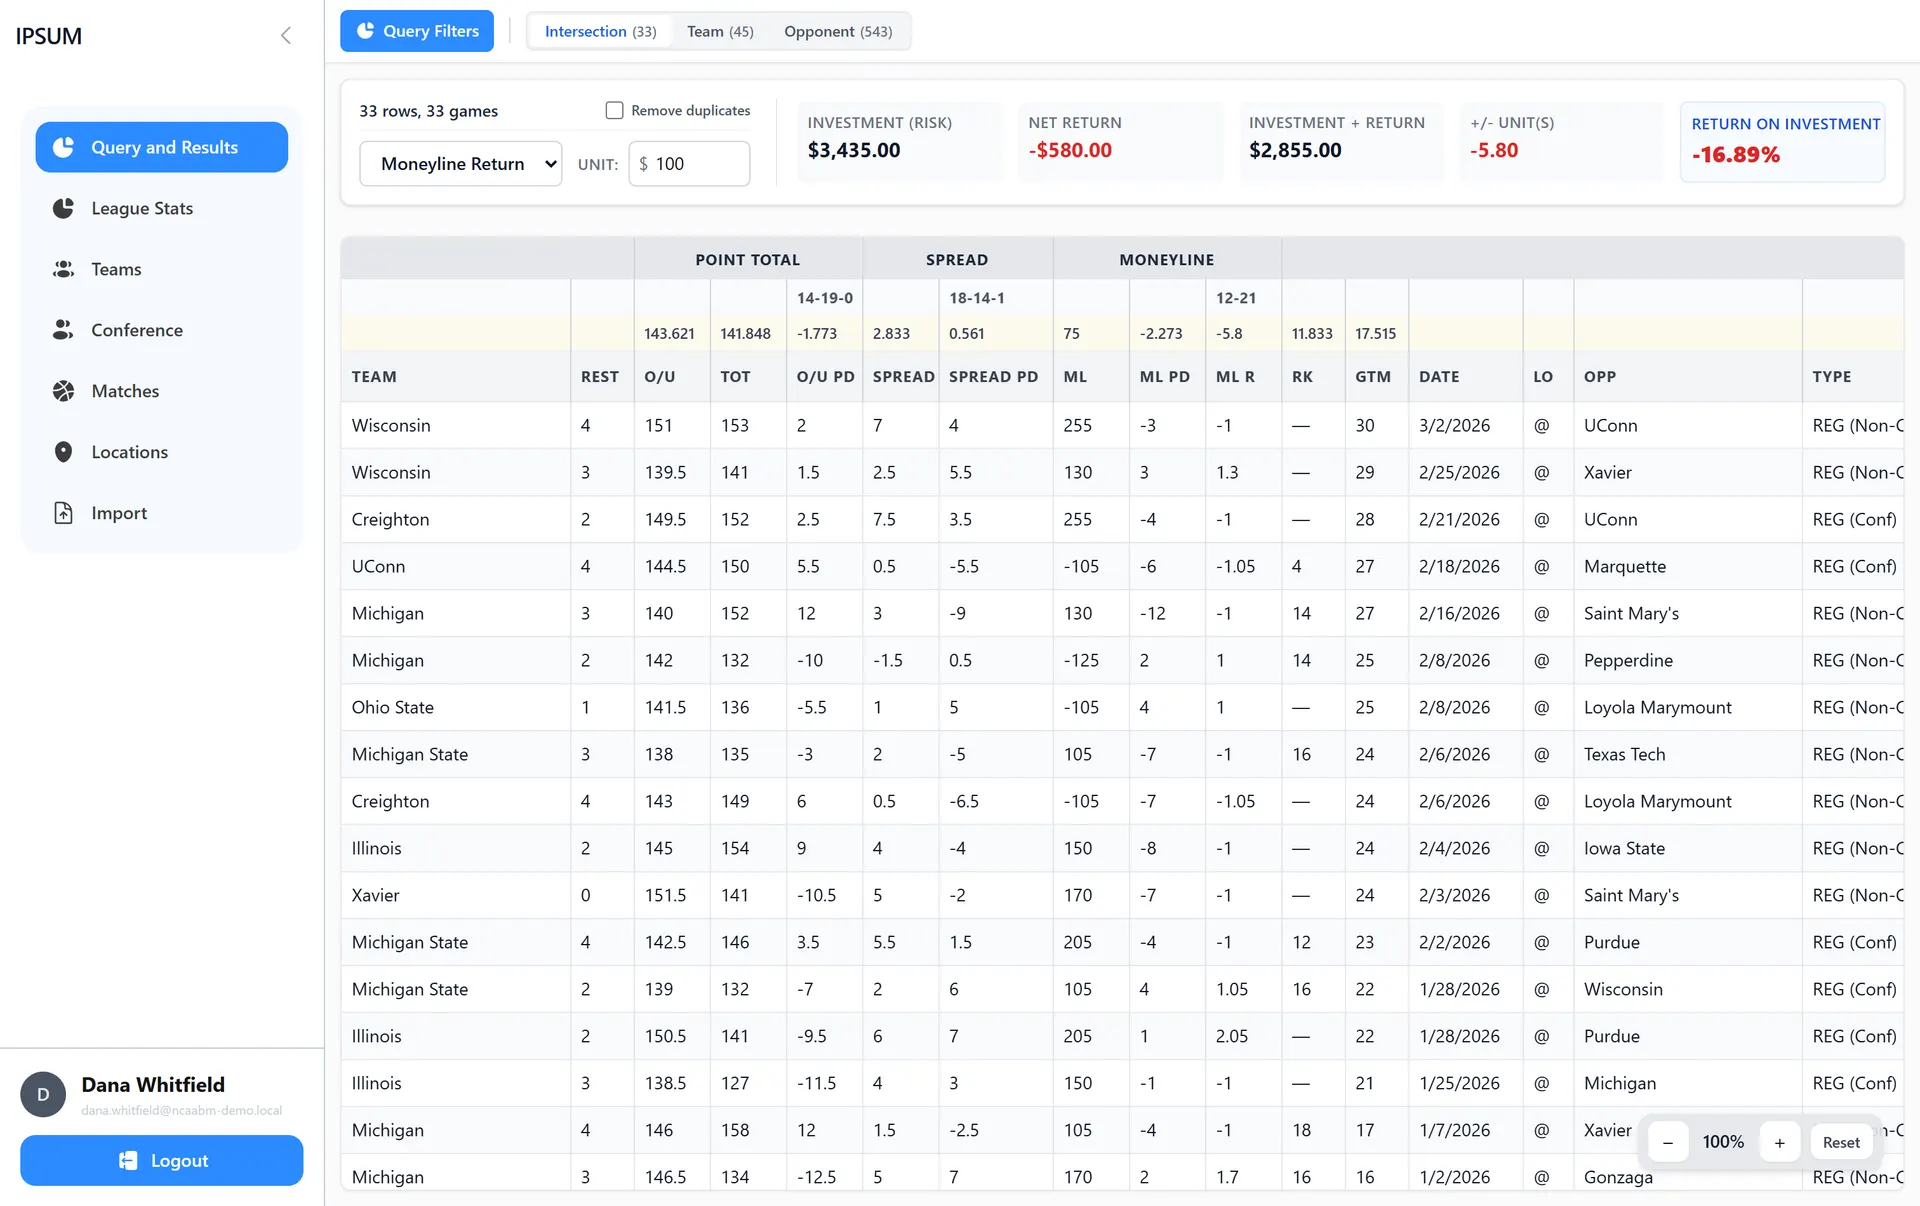
Every result set feeds a returns panel that simulates a flat-unit betting strategy across the matched games in four modes, moneyline, spread, over, and under, reporting total risk, net return, plus/minus units, and ROI at a configurable stake, pricing spread and totals bets at standard -110 juice. The calculations replicate the formulas from the original Excel workbook, so results are directly comparable with the analyst's prior process.
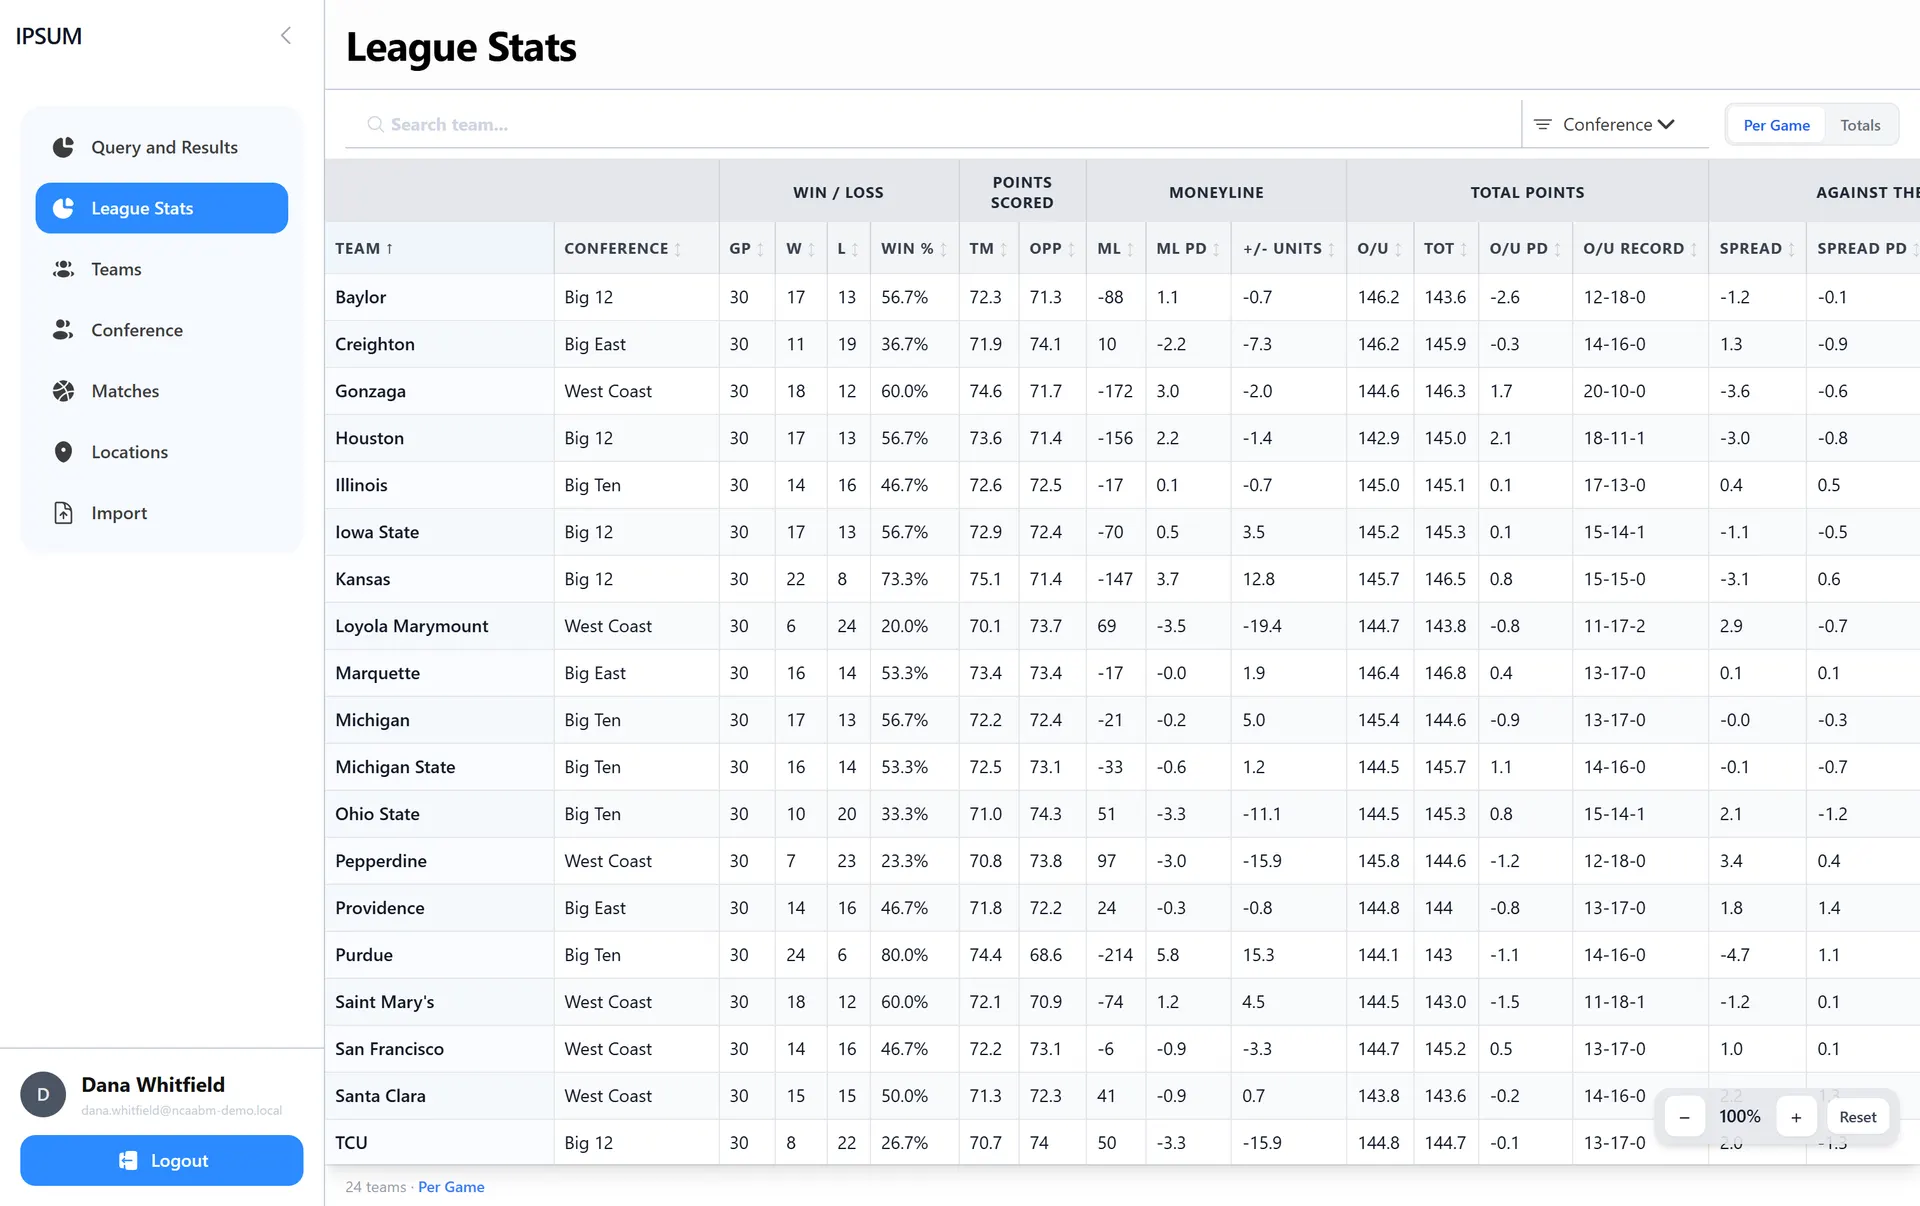
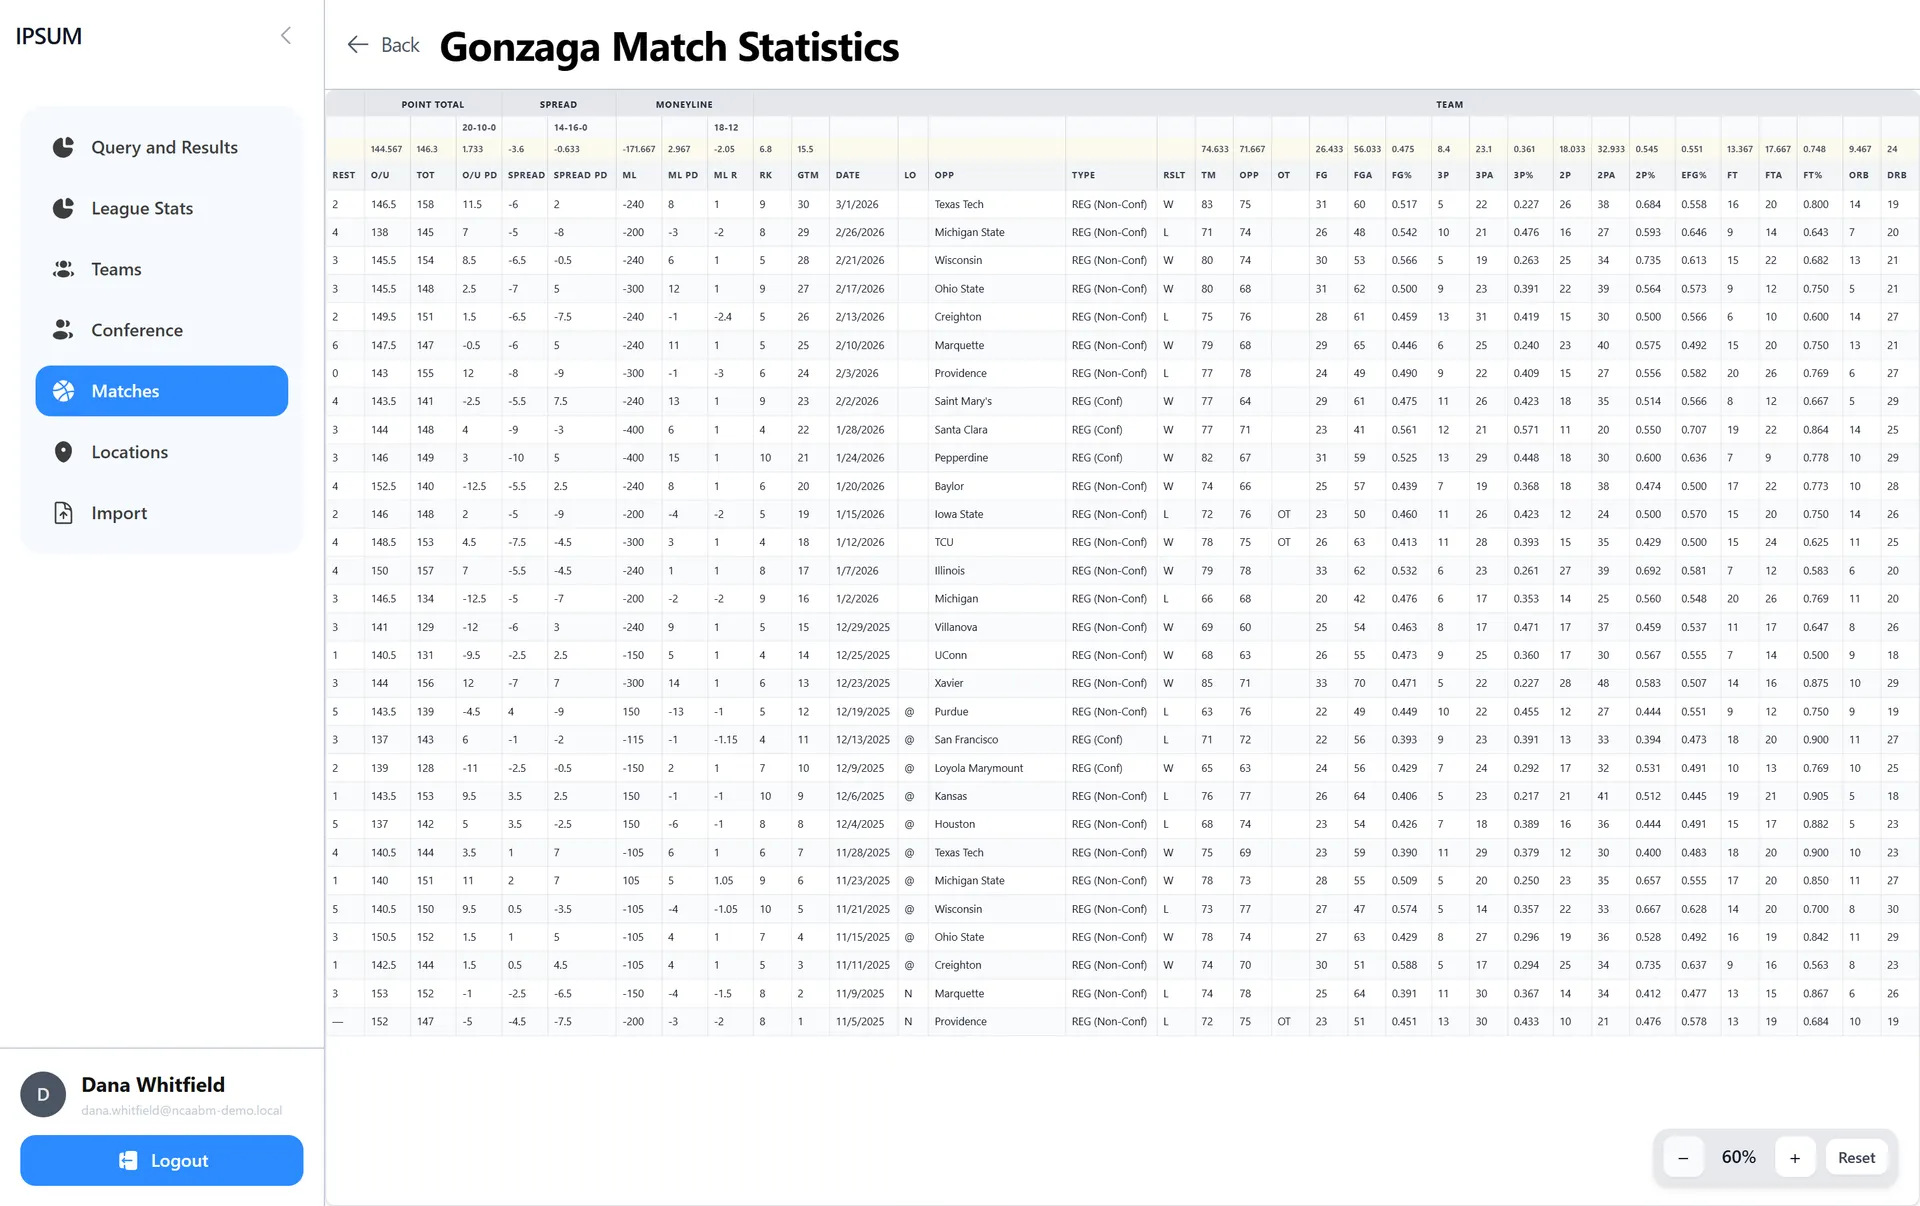
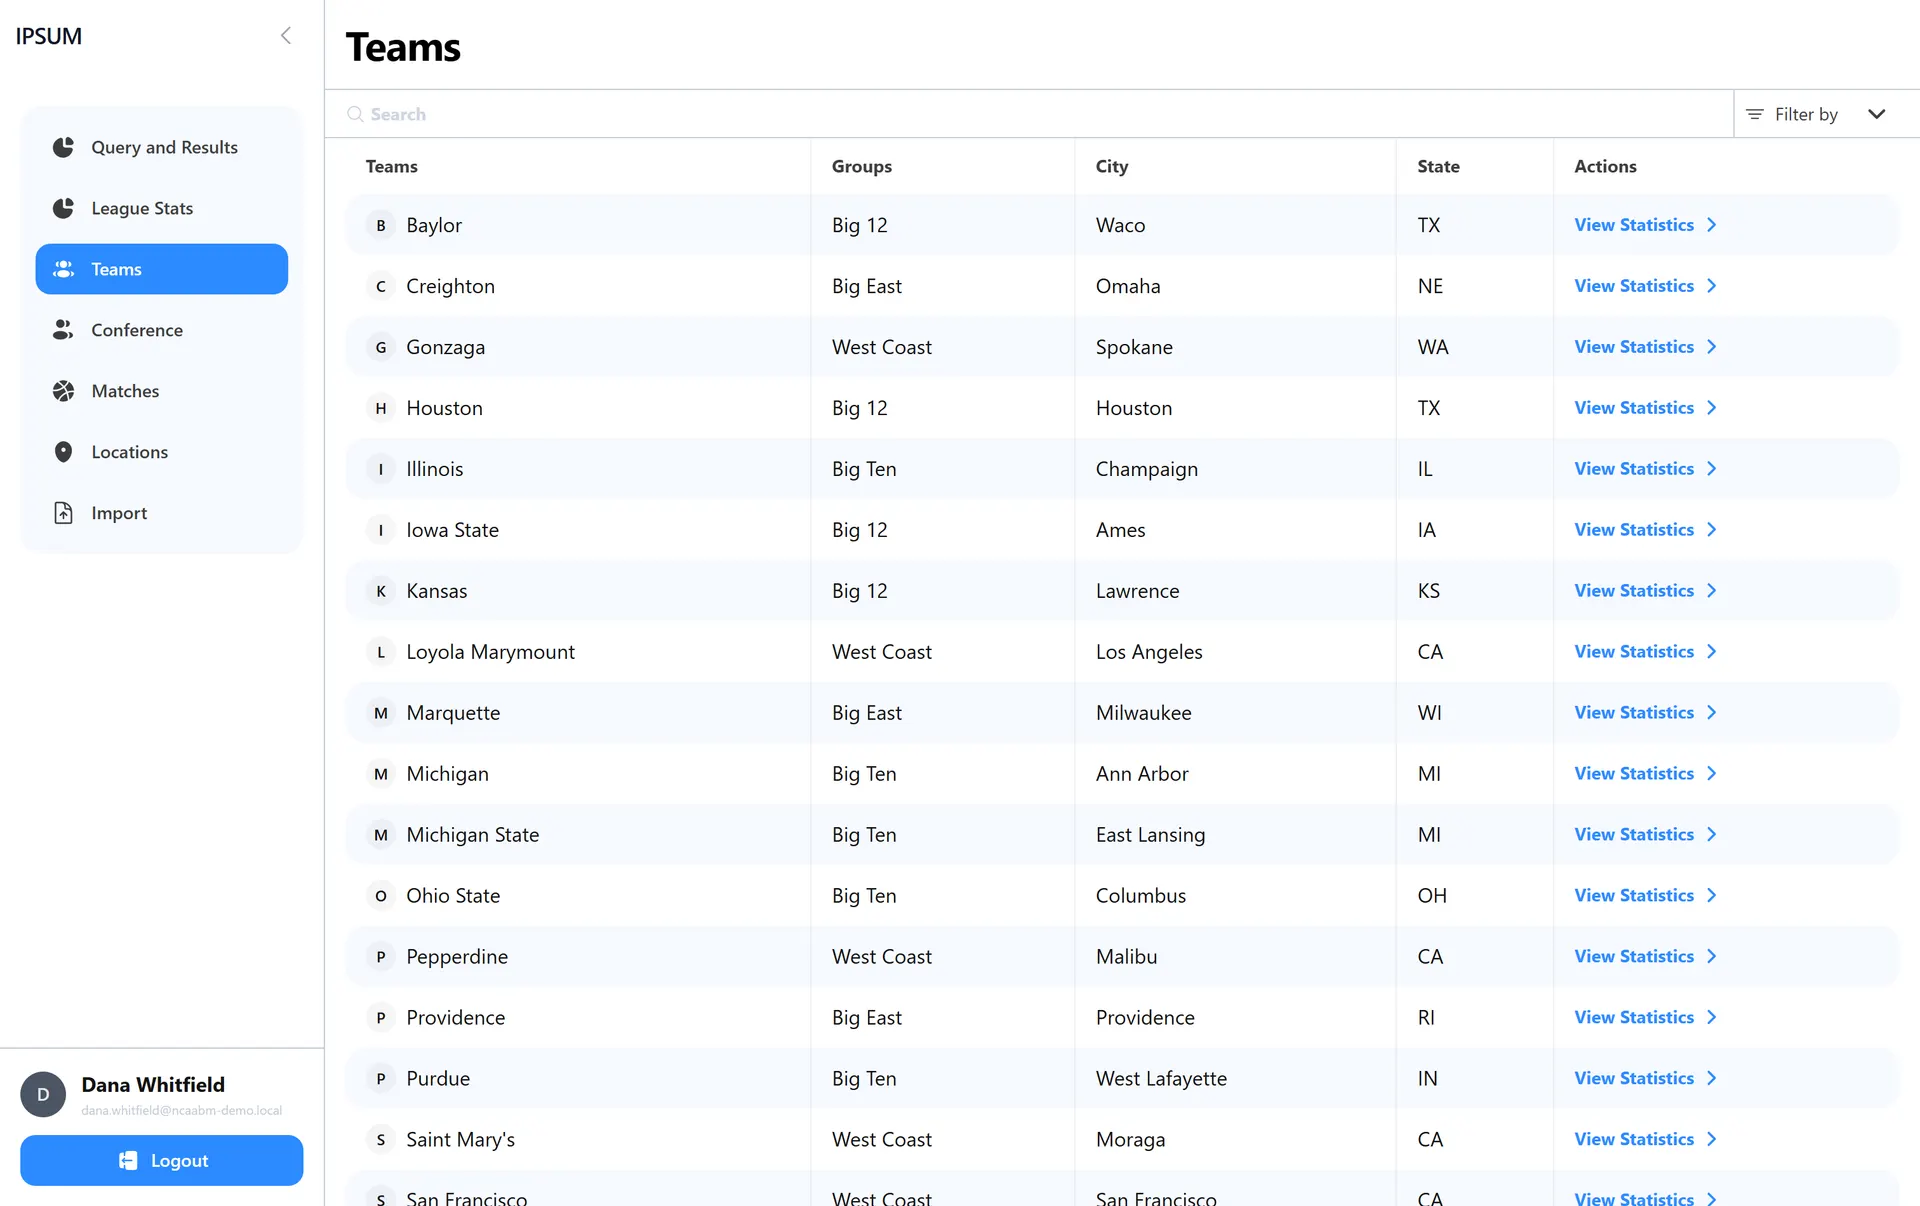
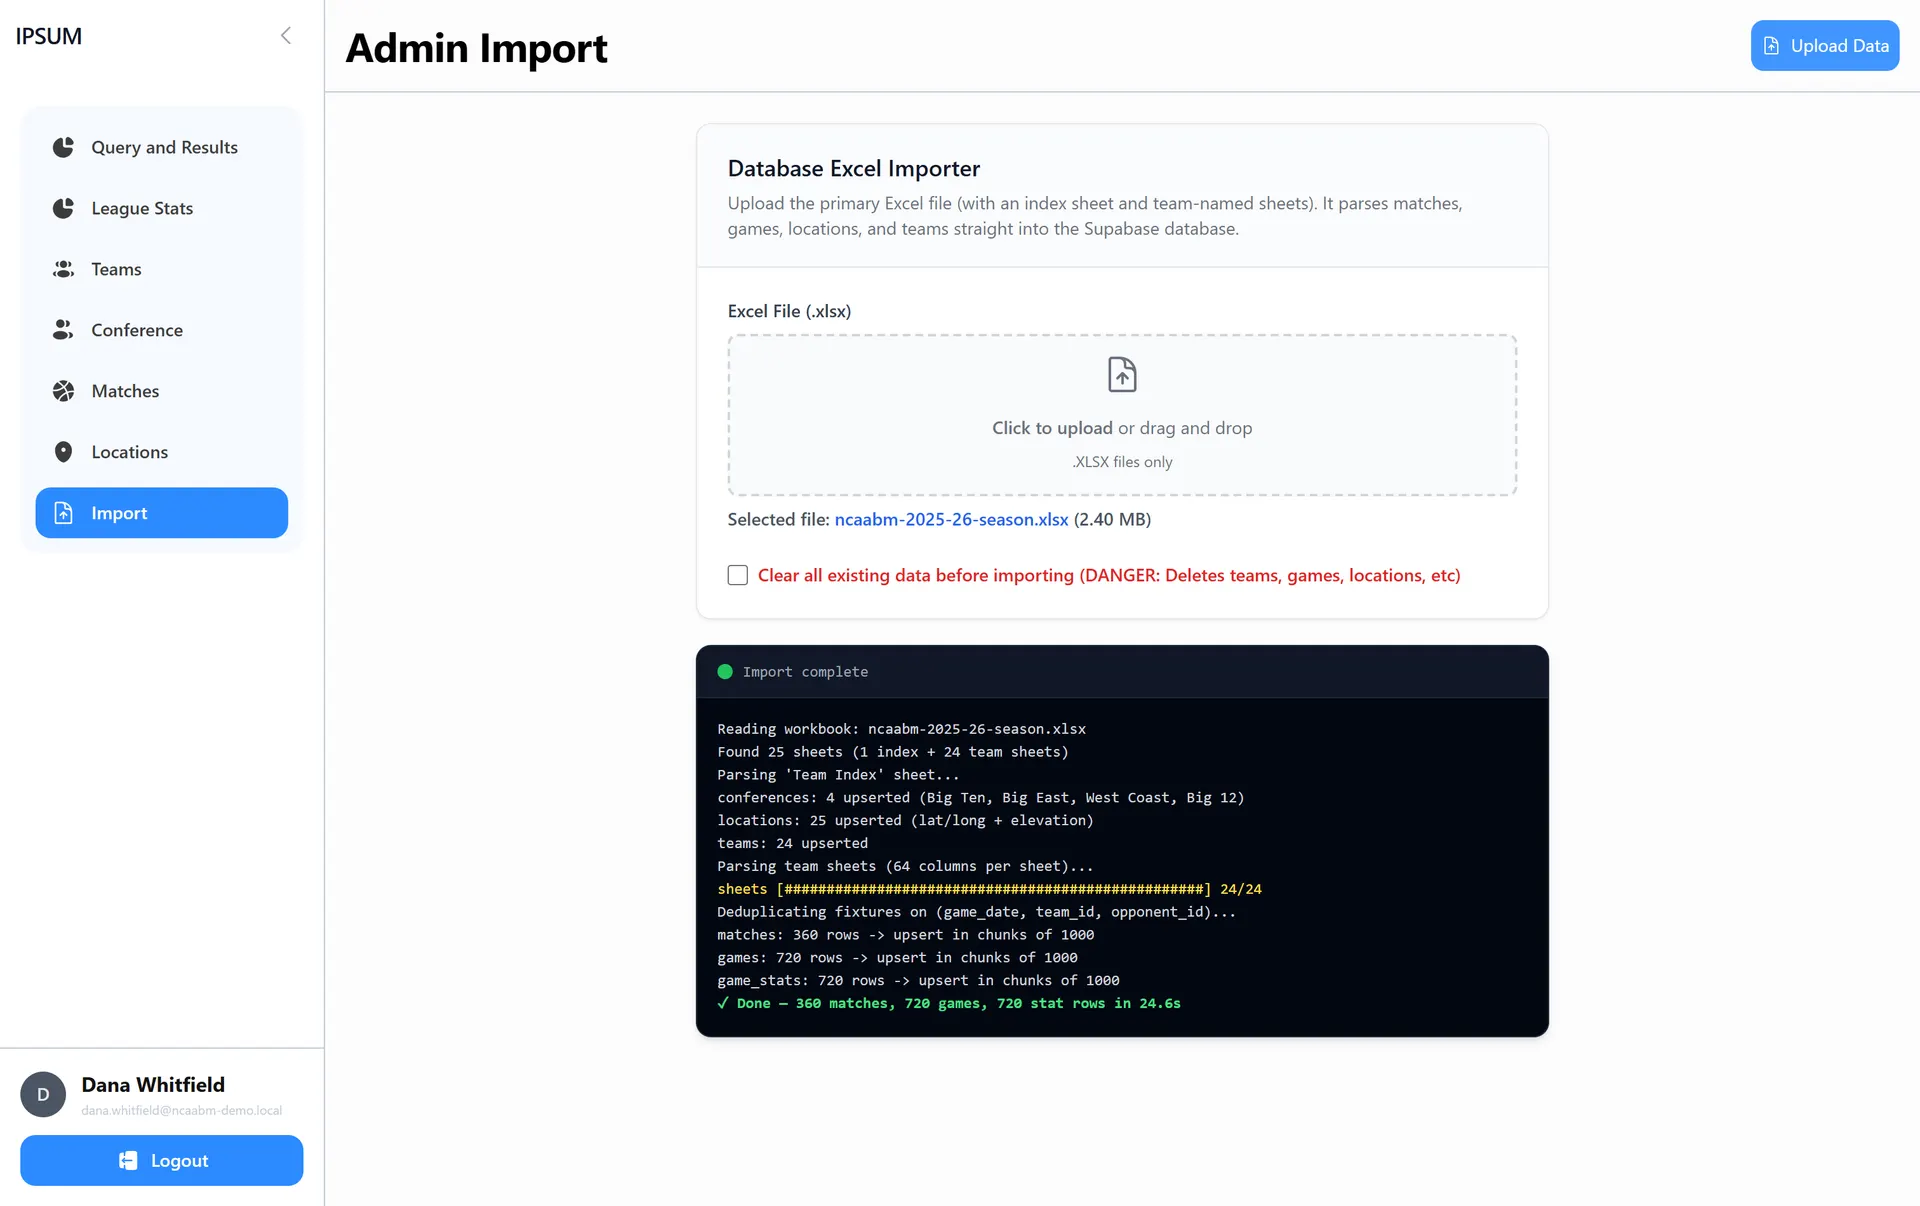
Results render in a spreadsheet-style grid built for large outputs: row virtualization keeps thousands of rows responsive, grouped column headers mirror the workbook layout, and pinned summary and averages rows reproduce the Excel formula rows, including W-L-push records for spread and over/under outcomes. Around the core sit a League Stats view aggregated in a PostgreSQL view, per-team game logs with server-side pagination, browsable team and venue directories, and an Import screen that streams the entire workbook load over Server-Sent Events with live log lines and progress.
Situational query engine
Around 65 queryable characteristics with current-game thresholds, previous-game streak conditions, season-average comparisons, and cross-characteristic correlation, evaluated over each team's full ordered game history.
Independent team and opponent criteria
Team-side and opponent-side filters are defined separately, and the engine returns team, opponent, and intersection result sets presented as switchable tabs.
Betting-return simulation
Flat-unit strategy simulation across any matched result set in moneyline, spread, over, and under modes, reporting risk, net return, plus/minus units, and ROI at a configurable stake.
Excel-faithful results grid
A virtualized spreadsheet-style grid with grouped headers mirroring the workbook, pinned summary and averages rows, Ctrl+scroll zoom, and a duplicate-collapsing toggle.
League-wide stat aggregation
One row per team covering W-L, against-the-spread and over/under records, moneyline units, and per-game box-score averages, computed in a PostgreSQL view so the page is a single query.
Streaming Excel import
Drag-and-drop workbook import with live progress and log lines streamed over Server-Sent Events, chunked deduplicated upserts, and an optional full-refresh mode.
- 01
Application-level characteristic evaluation
Streaks, in-a-row counters, season-to-date averages, and correlated subsets depend on each game's position in an ordered history; implementing them in TypeScript over a single per-team fetch keeps the semantics precise where SQL would be contorted.
- 02
Dual-perspective game model
Each fixture stored as one match and two team-perspective game rows, with a JSONB view embedding both teams' box scores per game, making team-versus-opponent queries symmetrical and eliminating join fan-out.
- 03
Idempotent streaming import
SheetJS parsing on Next.js API routes with progress streamed over Server-Sent Events, deduplication on game date and team pairing, and unique indexes that make re-imports safe. A Python CLI version of the importer exists for command-line use.
- 04
Provisioned-access authentication
Supabase email/password sign-in with no public signup, server-side verification of invite and password-recovery links, middleware session refresh on every request, and a client-side guard around the workspace.
- 05
Travel analytics
Haversine distance and elevation-difference calculations from venue coordinates power the travel-related query characteristics.
- A full league's game, box-score, betting-line, and travel data centralized in one queryable database.
- Layered situational questions, streaks, season averages, correlated conditions, opponent-side criteria, answered in seconds where a spreadsheet could not express them at all.
- Betting returns simulated across any matched set of games in four bet types, using formulas that replicate the analyst's original workbook so the numbers verify against the process they replace.
- The entire dataset reloadable from the existing Excel format through observable, idempotent imports.